Shannon Entropy from Theory to Python
Being able to quantify the amount of information in a sequence is important in many fields and applies to many data set. Shannon Entropy is one such information theory method that given a random variable and historic about this variable occurrence can quantify the average level of information!
Being able to quantify the amount of information in a sequence is important in many fields and applies to many data set. For instance, it allows to quantifiably and objectively answer questions like "which of these two data set is more information rich"?
Shannon Entropy is one such information theory method that given a random variable and historic about this variable occurrence can quantify the average level of information/surprise/uncertainty/complexity.
In this short tutorial we will go through these following points:
- What is information?
- The formula behind Shannon Entropy.
- A research paper example using Shannon Entropy.
- Finally a python implementation of Shannon Entropy with DNA sequences of nucleotides!
If you are a researcher or a data scientist wanting to know a bit more about this metric, this short post is for you!
What is Information? ✉️
To start of, here is very good explanation of how information can be viewed with the lens of surprise [From Wikipedia]:
The core idea of information theory is that the "informational value" of a communicated message depends on the degree to which the content of the message is surprising.
If a highly likely event occurs, the message carries very little new information. On the other hand, if a highly unlikely event occurs, the message is much more informative. For instance, the knowledge that some particular number will not be the winning number of a lottery provides very little information, because any particular chosen number will almost certainly not win.
However, knowledge that a particular number will win a lottery has high informational value because it communicates the outcome of a very low probability event.
This means that one of the core ingredient when we look at information is the probability of a component of the message to appear.
The link is clear, if a component of a message (i.e. let's say a type of letter) has a very high probability of occurring in a sequence, it is not surprising if it does appear. However, if the probability it appears is closer to 0 it will be more surprising.
There is therefore an inverse relationship between information and the probability of occurrence. Given this initial insight, Shannon in his foundational paper A Mathematical Theory of Communication defined a metric that given the probability of occurrence of components can quantify the amount of information a sequence has.
Let's look at the formula for this metric!
Formula Explanation 📐
The formula for Shannon Entropy is pretty simple and compact:
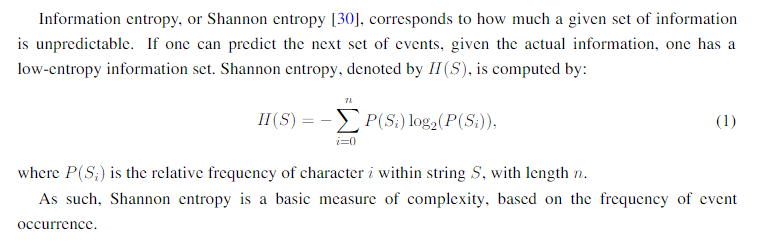
Given a discrete random variable X, with possible outcomes x1,...,xn, which occur with probability P(x1),...,P(xn), the entropy of X is formally defined as:
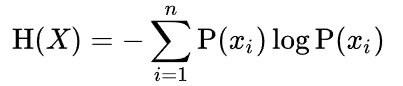
Where sigma denotes the sum over the variable's possible values. Usually the log here is base 2, but changing the logarithm will change what unit of entropy you get.
Therefore in order to calculate Shannon Entropy you need to first get all of the probability of your random variable X.
Remember that Shannon Entropy works on sequences (or probability distribution built from sequences) therefore, you need to have an historic already built up of what your sequence of interest looks like.
As an example if we are trying to calculate the Shannon Entropy of a given DNA sequences composed of these characters {'A', 'T', 'C', 'G'}, we need to first figure out what the probability of seeing any of these character is.
Therefore we would run through the sequence and calculate an approximation of the probability of seeing any of these characters which would give us: P(A), P(T), P(C) and P(G).
With this information we would then iterate on each of these probability do the multiplication, sum them all together and take the negative value of the sum to get the final Shannon Entropy metric. Which unrolled would look like this:
H(X) = - ((P(A)*log(P(A)) + (P(T)*log(P(T)) + (P(C)*log(P(C)) + (P(G)*log(P(G)))
Pretty simple! ✨
Let's check out an example analysis with Shannon Entropy from a research paper calculating the information content of DNA sequences.
Example Analysis with Shannon Entropy 📜
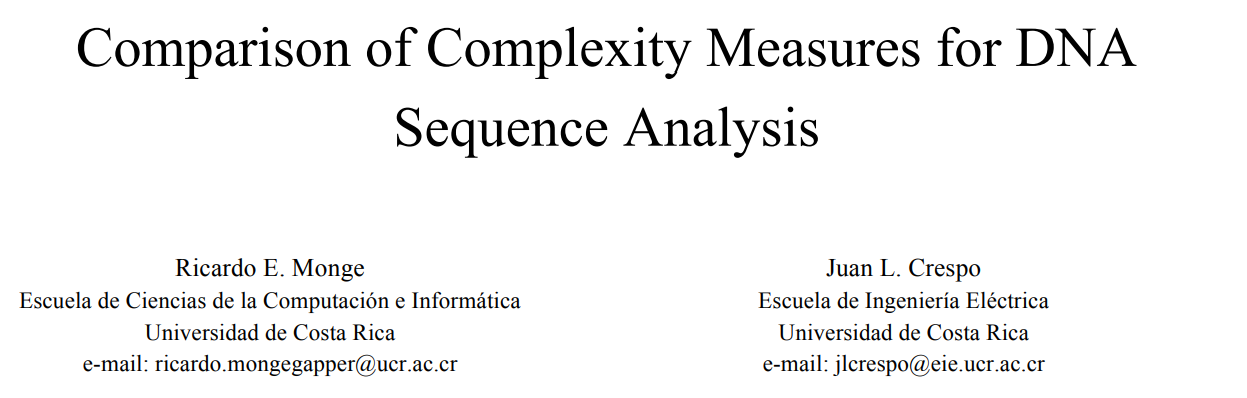
One paper I've been reading recently that looks at various complexity measure for DNA sequence analysis made use of Shannon Entropy to quantify the amount of complexity in small segment of the Y chromosome.
Basically, the paper used a variation of the following pipeline in order to calculate Shannon Entropy on overlapping windows across the whole chromosome:
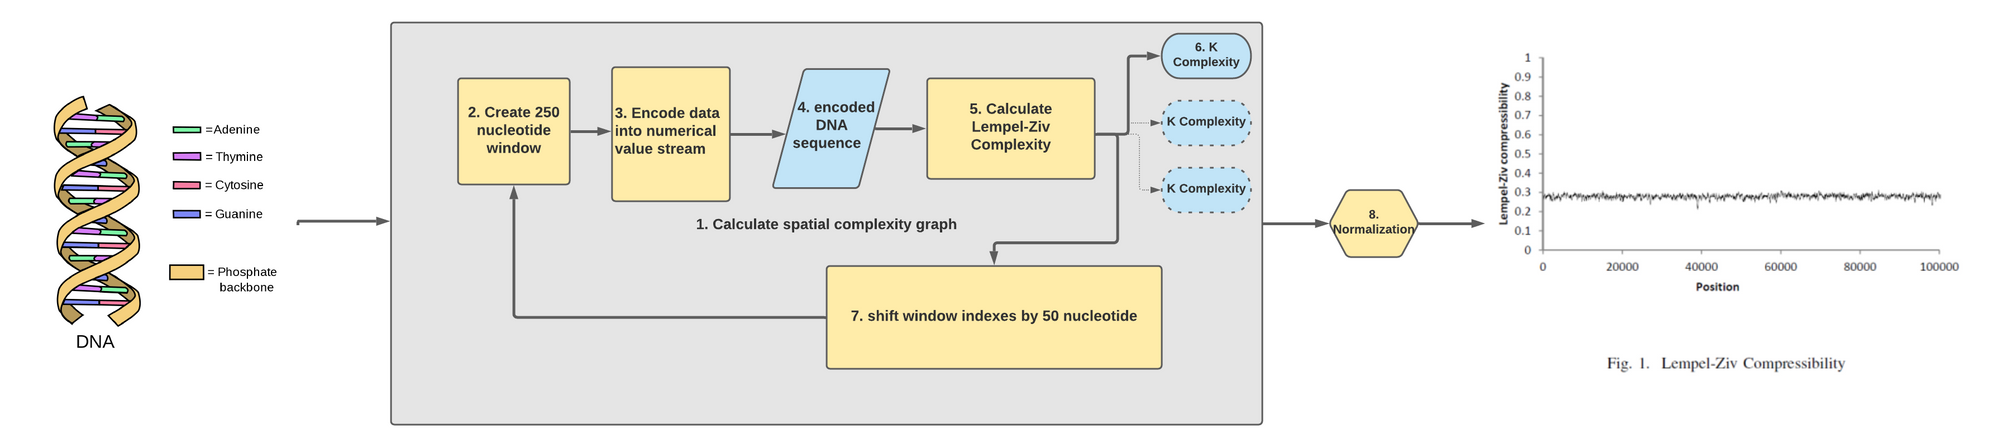
Meaning the following recipe was applied to get a Shannon Entropy metric:
- Load the Y chromosome DNA (i.e. a mega string of the character 'A', 'T', 'C', 'G').
- Cut a 250 nucleotides sub-segment.
- Calculate Shannon Entropy on the sub-segment by using the frequency of the characters as the P(X).
- Move the window by 50 nucleotide to the right and go back to step 2 until you hit the end of the chromosome.
After the analysis was run through this pipeline, the Shannon Entropy across the DNA sequence was plotted on a graph to yield the following map:
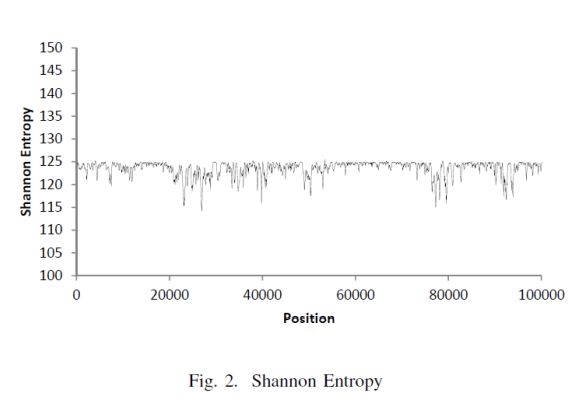
Long story short, with this metric we are able to know on a DNA sequence which area in the chromosome is more or less "surprising" and have higher information content.
There is an important distinction in this paper to keep in mind with respect to the formula! For some reason, the author decided to use a definition of Shannon Entropy that is different from the literature (as far as I can tell).
It was confusing at first, but after reading another one of his paper it became obvious that the formula he used is treating the variable i in Shannon's formula to be the index of the character in the string!
Therefore, the range of Shannon Entropy will be bigger than if you simply sum over the 4 possible letters {A, C, T, G} since the length will be of size 250! It's not terribly important since the shape of the graph will stay roughly the same, but this information is crucial to get to the same results.
Let's now look at how we can reproduce that graph with a Python implementation!
Python Implementation on DNA Sequences 🧬
We will do two implementation of the calculation of Shannon Entropy, one to mimic the result of the previous paper and one that will use a definition of Shannon Entropy that is more similar to the literature!
The full code can be found in this notebook on my Github Repository!
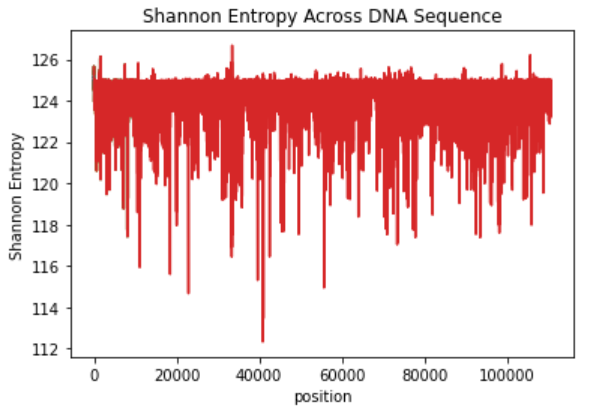
String Index Implementation
Here is the code that I managed to figure out for this paper:
What we are doing first off is to create a dictionary of relative frequency for each of the nucleotide type. Then we iterate over each of the characters in the sequence and use the previously calculated relative frequency in the sum of the multiplication!
Basically it means that we are doing 250 sums of the P(xi)*log(P(xi)), so the bias will be higher than the other implementation we will see shortly.
We get the following plot!
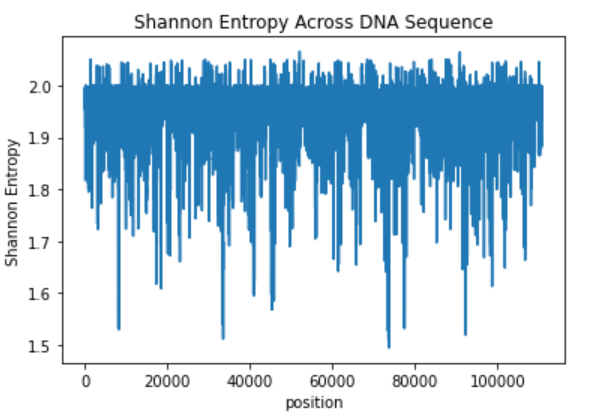
Classical Implementation
Here is the code for the more classical implementation:
There isn't much to say. We count each nucleotide occurrence in the string and divide that frequency by the length of the DNA sequence. Then we sum all of the probability multiplication!
This means that we only have to do a sum of 4 times P(xi)*log(P(xi)) in this case!
We get the following graph, which looks similar in shape than the previous one (roughly).
The metric isn't too complicated, however it's implementation when the probability distribution isn't known is a bit confusing...
However you implement Shannon Entropy, just be certain that you are following the right standard in your field! Otherwise you might get confusing results!
Conclusion
Shannon is a very useful tool to have in your researchers toolbelt when it comes to getting more insight about a sequence. It's very easy to use, theoretically sounds and is most likely already commonly in use for your type of dataset. This allows you to gain deeper understanding of your data while leaning on the rest of the scientific literature to augment your discussion!
Furthermore, it's also heavily used in machine learning! For instance in decision tree, Bayesian inference or used in the cross entropy loss function! Understanding the background of where it comes from gives you a better intuition about the behavior of some of the analysis that produce your machine learning result!
Hope this was useful!
Let me know if you have any question about this or similar topic! Don't forget to subscribe to get more AI related content every week!
👺👺👺